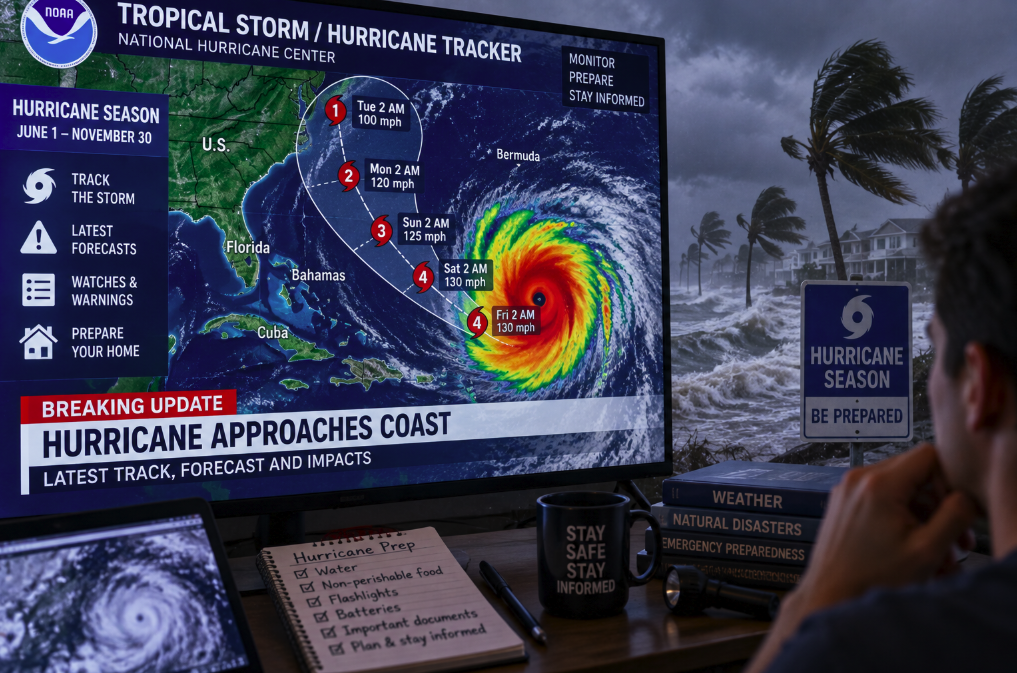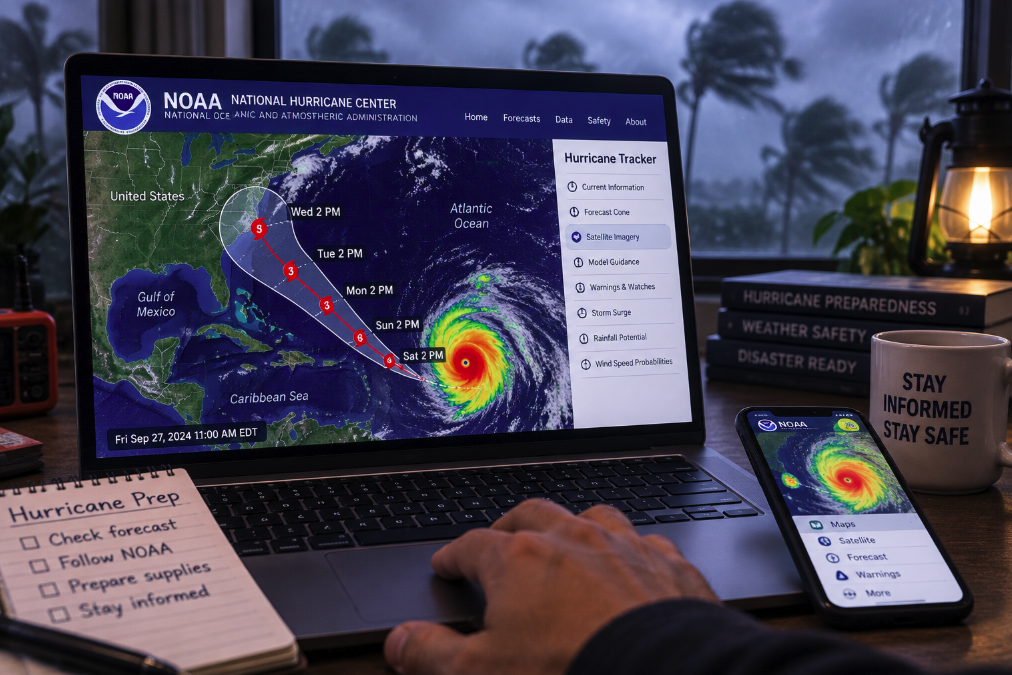
When a tropical system appears in the Atlantic, the urge to watch it move across a map can become almost compulsive. A disturbance off Africa becomes a colored area on an outlook. A few days later it may have a name. Soon there are satellite loops, forecast dots, spaghetti models and a white cone pointing toward an island or coastline. Every update seems to move the future.
The best place to follow that process for the Atlantic and eastern Pacific is not a viral screenshot or an unlabeled weather-app map. It is the National Hurricane Center, the NOAA agency responsible for official U.S. tropical cyclone forecasts and warnings.
But using the official tracker correctly requires understanding what its maps actually say. The most famous hurricane graphic—the forecast cone—is also one of the most frequently misunderstood weather images in America.
Start with the Tropical Weather Outlook
Before a hurricane exists, the National Hurricane Center monitors areas where tropical cyclones could develop. The Tropical Weather Outlook is the first useful map to check because it covers potential development across the Atlantic basin, Caribbean Sea and Gulf.
The outlook assigns probabilities to disturbances that forecasters believe could become tropical cyclones during specified periods. Those percentages describe the chance of formation, not the probability that a storm will strike Florida, Texas, North Carolina or any other location.
A tropical wave can also exist without being a tropical cyclone. Waves are broad atmospheric disturbances that commonly travel westward through the tropics. Some eventually organize into tropical depressions; many do not.
That distinction is useful in real time. At the September 10, 2026 research snapshot for this article, the NHC reported no active tropical cyclones in the Atlantic and said tropical cyclone formation was not expected during the following seven days. Its Tropical Weather Discussion nevertheless described tropical waves approaching Cabo Verde and east of the Lesser Antilles. There was weather to monitor, but there was no Atlantic hurricane to track.
That situation can change after publication, which is precisely why the live NHC page matters more than a static article for current conditions.
Once a storm forms, the tracker becomes much more detailed
When a system becomes a tropical depression or named storm, the NHC creates a dedicated set of products. The public advisory provides the storm's current location, movement, maximum sustained winds and central pressure. The forecast discussion explains the reasoning behind the official forecast, including uncertainty and changes from previous advisories.
The graphical products then turn those numbers into maps. You can examine the forecast track, watches and warnings, wind-speed probabilities, estimated arrival time of tropical-storm-force winds, cumulative wind history and, when relevant, storm-surge information.
Satellite imagery answers a different question: what does the storm look like now? It can reveal the organization of thunderstorms, the development of an eye and changes in cloud structure. Radar becomes especially valuable when a cyclone approaches land and enters the range of coastal radar stations.
Neither satellite nor radar should be confused with the forecast track. One shows observations of the storm; the other estimates where its center may go.
The forecast cone is not the hurricane
The familiar white cone represents uncertainty in the predicted track of the cyclone's center. It does not show the physical size of the storm, the area that will definitely experience hurricane-force winds or the boundary between danger and safety.
The NHC builds the cone from circles placed along its official forecast track. For 2026, the size of those circles is based on official forecast errors from the previous five years, 2021 through 2025, and is designed so that roughly two-thirds of those historical center-track errors fall within the circles.
The cone therefore becomes wider farther into the future because forecast uncertainty increases with time. A narrow section near the storm does not mean the cyclone itself is small, and the wide end several days away does not mean the hurricane is expanding to that width.
This is the most important rule for reading a hurricane tracker: danger can extend far outside the cone. Tropical-storm-force winds, heavy rain, tornadoes, dangerous surf and storm surge can affect places well away from the forecast center.
There is another common mistake. The black center line is not a railway track that the hurricane is expected to follow precisely. Small shifts in the official forecast are normal. Focusing obsessively on whether the line moved 30 miles east or west can create a false sense of precision.
Use wind probabilities instead of staring only at the center line
If you want to understand the risk to a particular location, the NHC's wind-speed probability products can be more informative than the cone alone. They estimate the chance that a location will experience winds reaching specified thresholds, including tropical-storm and hurricane force.
The arrival time of tropical-storm-force winds is particularly useful for preparation. Once those winds begin, putting up shutters, moving outdoor furniture or evacuating can become difficult or dangerous. The map helps communicate when preparations may need to be completed rather than merely when the hurricane's center might arrive.
This also explains why emergency officials sometimes ask residents to act while the weather outside still looks perfectly normal. Evacuations and preparation have to occur before roads deteriorate and strong winds begin.
Storm surge needs its own map
Hurricane categories describe maximum sustained wind speed. They do not measure storm surge, rainfall or total destructive potential.
For coastal residents, storm surge can be among the most life-threatening hazards. Wind can push seawater onto normally dry land, and the local impact depends on the coastline, water depth, storm size, angle of approach and other factors.
When the threat warrants it, NHC products include storm-surge watches and warnings and maps showing potential inundation. These should be interpreted together with evacuation information from local emergency-management agencies.
A Category 1 storm should therefore never be dismissed as harmless simply because it sits at the lower end of the Saffir-Simpson Hurricane Wind Scale. A lower-category cyclone can still produce catastrophic flooding.
What about spaghetti models?
One of the internet's favorite hurricane images is the “spaghetti plot,” a collection of tracks generated by different forecast models or model ensembles. It can be useful to meteorologists, but it is easy to misuse.
Individual model tracks are not equivalent to official forecasts. Models differ in their assumptions, resolution and performance, and some lines circulating online may represent ensemble members rather than independent forecasting systems. A single alarming line crossing your city does not mean forecasters believe that outcome will occur.
The official NHC forecast incorporates numerical models along with observations and expert analysis. For most people making real-world decisions, that official forecast and local National Weather Service guidance are more useful than choosing whichever model line looks most dramatic.
You can download the hurricane data yourself
For map enthusiasts, researchers and developers, NOAA goes far beyond static images. The NHC provides tropical cyclone data in GIS formats, including forecast tracks, cones, watches and warnings, wind fields and KML/KMZ products that can be loaded into compatible mapping software.
The GIS page also provides active feeds and links to additional NOAA mapping resources. This is useful if you want to overlay official hurricane data with geographic boundaries, infrastructure or other datasets rather than relying on a predesigned graphic.
Historical tracks are available through NOAA tools as well, although finalized data for a current season may not appear in historical databases until post-season analysis is complete.
A practical way to follow a storm
When rumors about a new Atlantic system begin circulating, first open the NHC Tropical Weather Outlook and verify that the disturbance actually exists in the official analysis. If it develops, move to the storm's dedicated advisory page and read the latest public advisory and key messages.
Then examine the cone for track uncertainty, wind probabilities for your location, arrival-time guidance for preparation deadlines and storm-surge products if you live near vulnerable coastal water. Check your local National Weather Service office and emergency-management authority for information specific to your community.
Finally, note the timestamp. Hurricane information ages quickly. A map saved yesterday afternoon may have been superseded by several forecast cycles.
The goal of a hurricane tracker is not to predict the exact street where a storm's eye will pass five days from now. It is to show how the range of plausible outcomes changes as new observations arrive. Read that uncertainty correctly, and the map becomes far more useful: not a crystal ball, but a continuously updated tool for understanding risk before the weather reaches the coast.